Counter
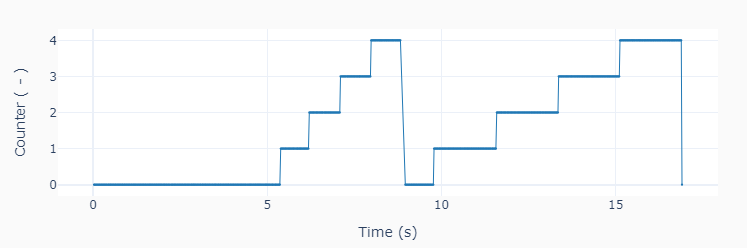
This example code shows how to use the touch sensor to count button press events. It resets the counter at numcount at repeats the cycle numcycle times before leaving the execution loop. A sampling period is used to store the time-based data for plotting in the end.
""" counter.py

Use the touch sensor to count events.

Setup:
    Connect touch sensor to port number 1.

"""
# Importing modules and classes
import time
import numpy as np
from pyev3.utils import plot_line
from pyev3.brick import LegoEV3
from pyev3.devices import Touch

# Defining parameters
numcount = 5  # Number of counter events before reset
numcycle = 2  # Number of counting cycles
tsample = 0.02 # Data sampling period (s)

# Pre-allocating output arrays
t = []
count = []

# Creating LEGO EV3 objects
ev3 = LegoEV3()
touch = Touch(ev3, portnum=1, inputmode='bump')

# Resetting sensor
touch.reset_count()

# Initializing current time stamp and starting clock
tprev = 0
tcurr = 0
tstart = time.perf_counter()
# Initializing counting parameters
countprev = 0
cyclecurr = 0
# Running execution loop
print('Running ... (Press touch sensor button)')
while cyclecurr < numcycle:
    # Getting current button press count
    countcurr = touch.output
    # Updating previous time and getting current time (s)
    tprev = tcurr
    tcurr = time.perf_counter() - tstart
    # Checking if count changed and updating previous count value
    if countcurr != countprev:
        print('Counter = ', countprev)
        countprev = countcurr
    # Resetting counter and updating current cycle
    # number if more than `numcount` occurred
    if countcurr >= numcount:
        touch.reset_count()
        countcurr = 0
        countprev = 0
        cyclecurr += 1
    # Acquiring data every `tsample` seconds
    # and appending values to output arrays
    if (np.floor(tcurr/tsample) - np.floor(tprev/tsample)) == 1:
        t.append(tcurr)
        count.append(countcurr)
print('Done.')
# Closing brick connection
ev3.close()

# Plotting results
plot_line([t], [count], yname=['Counter ( - )'], marker=True)