Utils
Contains a useful plotting function that is used in the coding examples. The function was built using Plotly instead of Matplotlib due to its interactive graphs. It works well in an interactive session in VSCode. In terminal mode, the results are displayed in a web browser.
>>> import numpy as np
>>> from pyev3.utils import plot_line
>>> t = np.linspace(0,2,100)
>>> y0 = np.sin(1*np.pi*t)
>>> y1 = np.cos(1*np.pi*t)
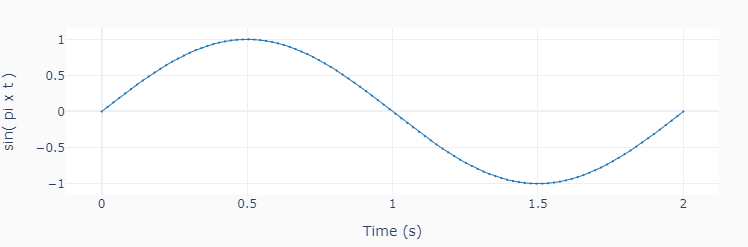
>>> plot_line([t], [y0], yname='sin( pi x t )', marker=True)
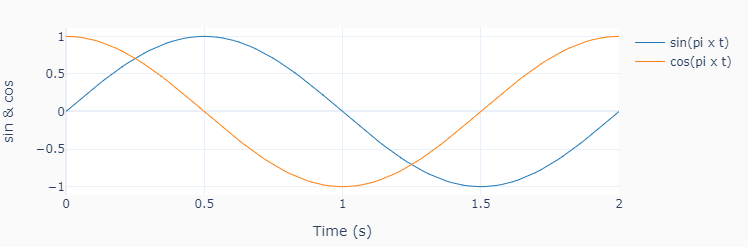
>>> plot_line([t]*2, [y0, y1],
              yname=['sin & cos'],
              legend=['sin(pi x t)', 'cos(pi x t)'])
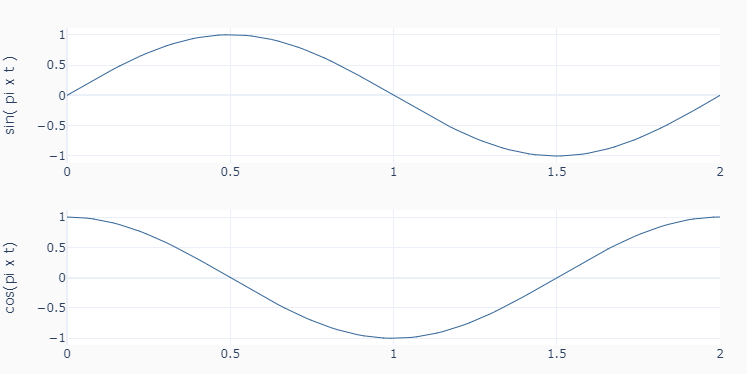
>>> plot_line([t]*2, [y0, y1],
              yname=['sin( pi x t )', 'cos(pi x t)'],
              axes='multi')